
Product
The numbers, in under three clicks.
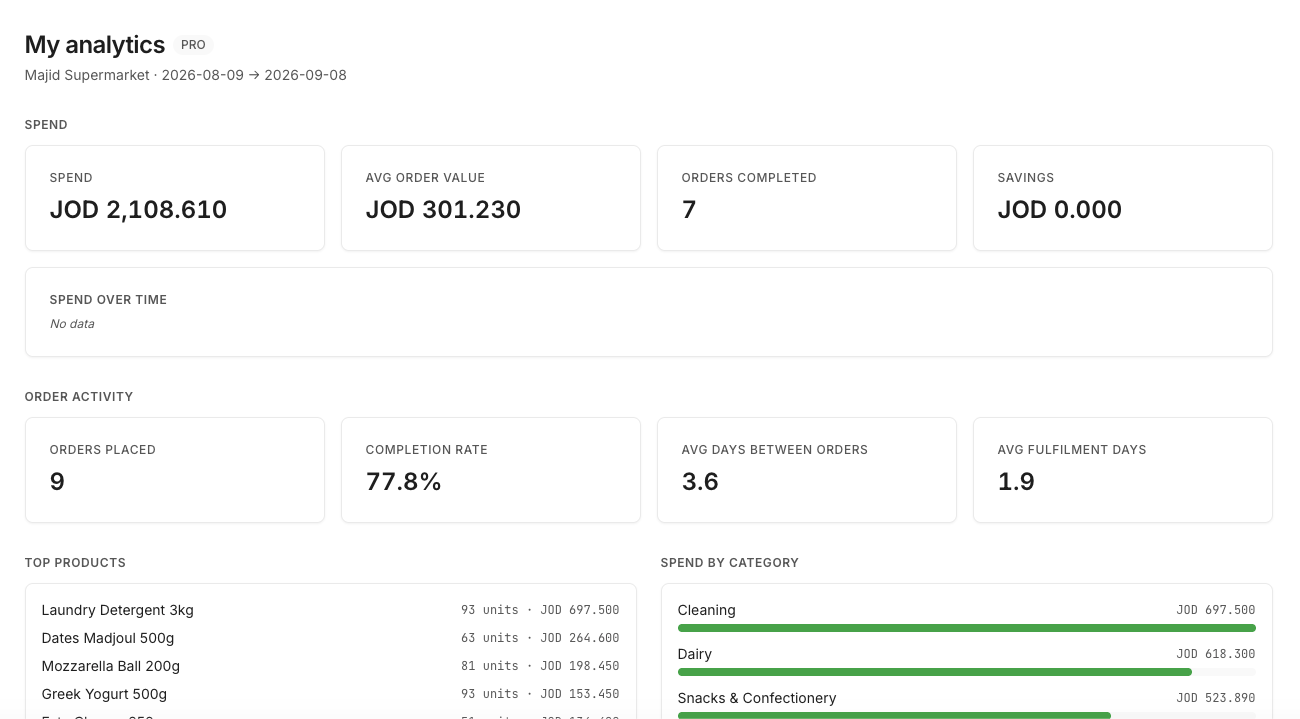
Suppliers see sales, receivables and rep performance. Retailers see spend, price changes and savings. Both filter, drill down and export.
What you can answer
Which SKU is up or down, by city
Filter by city, area, category, brand and time; every chart reachable in three clicks or fewer.
Which retailer is quietly late
Receivables aging with the retailers most at risk on one screen.
Which supplier crept a price up
Price-change alerts for retailers, with the before and after.
Where you stand among peers
Anonymised benchmarks for suppliers; nobody sees anybody's figures.
How it works
1. Every order writes the data.
Sub-orders, prices, credit and cheques are structured from the first tap, so there is nothing to re-key.
2. The dashboard answers the question.
Pick a period, a city or a category and the charts follow, in under two seconds on the dashboard.
3. Take it with you.
Export any view to XLSX or PDF, or get the month-end pack per rep and warehouse.
On both sides
For the supplier
- Sales, receivables aging and rep performance
- Month-end PDF pack per rep and warehouse
- Anonymised peer benchmarks
For the retailer
- Spend by supplier, category and branch (Pro)
- Price-change alerts and savings this month against last
- Multi-branch roll-up with inherited terms
Three questions
What people ask about this first.
Ordering, invoices and cheques are free forever. The analytics views are Pro, JOD 39 a month, with a 14-day trial after the tenth completed sub-order.
A supplier sees their own sales to you, never your spend with other suppliers.
They aggregate across suppliers in the same category and area and never show a single supplier's figures.
Where FMCG gets done.
Retailers sign up free. Suppliers apply, get verified, and start the 14-day Growth trial.